In my various pentesting experiments, I’ll pretend to be a blue team defender and try to work out the attack. If you have good security eyes, you can search for unusual activities in the raw logs — say a PowerShell script running a DownloadString cmdlet or a VBS script disguised as a Word doc file — by scrolling through recent activity in the Windows Event Viewer. It’s a major headache. Thankfully Microsoft has given us Sysmon, to make the threat analysis task far more straight forward.
- Part I: Introduction to Sysmon Log Analysis
- Part II: Deeper into Sysmon and Threat Detection
- Part III: Finding Unusual Sub-Graphs (Simple Example)
- Part IV: Random Walk Theory and Practical EQL
- Closing Thoughts on DIY Threat Solutions
Want to understand the ideas behind threats that show up in the Sysmon log? Download our Guide to WMI Events as a Surveillance Tool to learn how insiders can stealthily spy on other employees!
Get the Free Pentesting Active
Directory Environments E-Book
One head-banging issue with the Windows Event log is that it’s missing parent process information, and so process hierarchies can’t be worked out. In contrast, Sysmon log entries have the process id of the parent, along with the parent process name and command line. Thank you Microsoft!
In Part II of this loooong post, we’ll take full advantage of this parent process information to create more complex mapping structures known as threat graphs. In Part III, we’ll look at a simple algorithm that scans the threat graph to find the usual activity by examining the “weight” of the graph. If you make it all the way to Part IV, your reward is a neat (and understandable) probabilistic method to find threats.
In this first part, let’s see what we can do with basic Sysmon information.
Part I: Intro to Sysmon Log Analysis
What’s the answer to event log confusion? Ultimately, a SIEM solution would help normalize the event information, making it more amenable to analysis.
But you don’t have to go that far, at least initially. A first step in understanding what SIEM can do is to try Windows wonderful freebie tool Sysmon. It’s surprisingly easy to work with. Go Microsoft!
What are the Capabilities of Sysmon?
In short: useful process information that’s readable (see graphic below)! You’ll get some amazing details not found in the raw Windows log, but most significantly these fields:
-
- Process id (in decimal format, not in hex!)
- Parent process id
- Process command line
- Parent process command line
- Hash of file image
- File image names
Sysmon installs as a device driver and service — more here — and its key advantage is that it takes log entries from multiple log sources, correlates some of the information, and puts the resulting entries into one folder in the Event Viewer, found under Microsoft->Windows->Sysmon->Operational.
In my own hair-raising expeditions through the Windows logs, I’ve had to bounce between, say, the PowerShell log folder, and then back to the Security folder and then scroll through separate Event Viewers heroically trying to match up entries. It ain’t easy to analyze and as I learned, it’s helpful to have a couple of aspirins in reserve.
Sysmon then provides a solid first step in providing useful — or actionable, as vendors like to say — information to help you begin to understand the underlying causes. For example, I remotely launched a stealthy wmiexec session simulating a clever insider lateral move. Below you can see what I found in the Windows Events log:
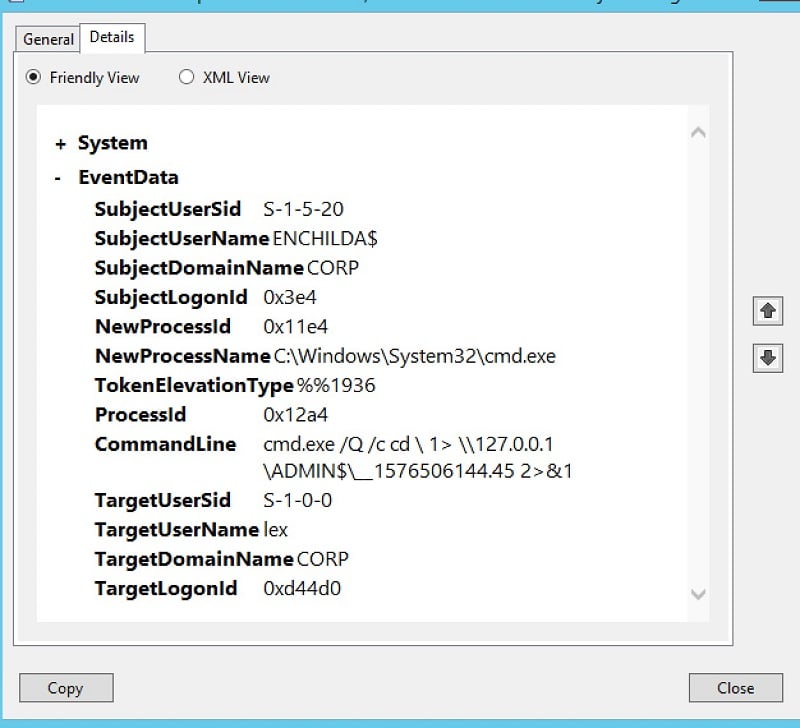
For an IT pro, with some hacking knowledge, this particular command line should trigger some suspicions. Using cmd.exe to then run another command while redirecting the output to a strangely named file is the stuff of some command-and-control (C2) software: it’s a way to create a pseudo-shell using the WMI services.
Let’s take a look at the equivalent entry in Sysmon, and gaze upon the wealth of extra information contained in a single log entry:
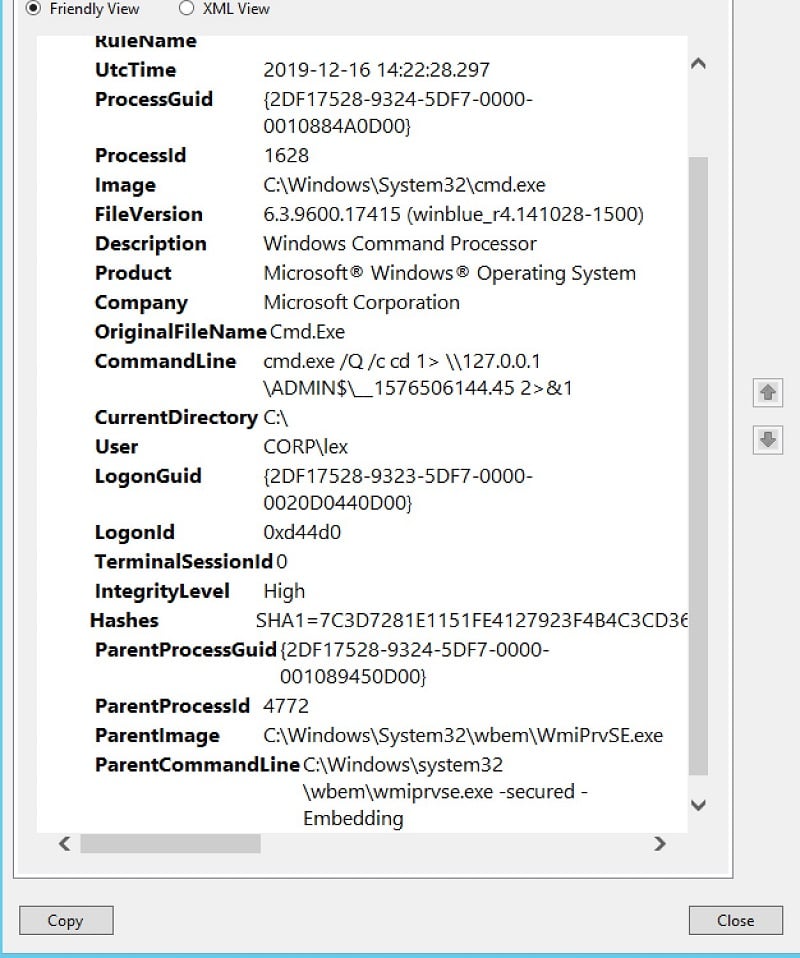
Not only can we see the actual command line, but also the file name and path of the executable, what Windows knows about it (“Windows Command Processor”), the process id of the parent, the command line of the parent which launched the Windows cmd shell, and the actual file name behind the parent process. We have it all, finally.
From the Sysmon log, we can conclude with good confidence that the strange command-line found in the raw files is not something crafted by an employee doing normal work. Instead, it was generated by a C2-like process — the wmiexec I mentioned above — and spawned directly by the WMI service process (WmiPrvSe). We now have the smoking gun that a remote attacker or insider is trying to probe the corporate IT system.
Introducing Get-Sysmonlogs
It’s wonderful that Sysmon puts all this log information in one place. Wouldn’t it even be more wonderful if we could access all the individual fields in the log programmatically, say, by a PowerShell cmdlet? We could then write a little PowerShell script to automate the process of finding potential threats!
I’m not the only one who’s had this idea. And thankfully there are some posts in forums and Github projects that explain how to use PowerShell to parse the Sysmon log. However, I wanted to avoid having to write separate lines of PS parsing script for each Sysmon field. Instead I took the lazy person’s approach to parsing Sysmon entries and I think I came up with something clever.
The first important point is that the convenient Get-WinEvent cmdlet can read the Sysmon logs, filter on appropriate events, and put the results into a PS variable, like below:
$events = Get-WinEvent -LogName "Microsoft-Windows-Sysmon/Operational" | where { $_.id -eq 1 -or $_.id -eq 11}
If you’re trying this at home, by displaying the contents of the first element of the $events array, $events[0].Message, you’ll notice it’s a series of one-line text strings following a very simple format: name of Sysmon field, a colon, and then the value.
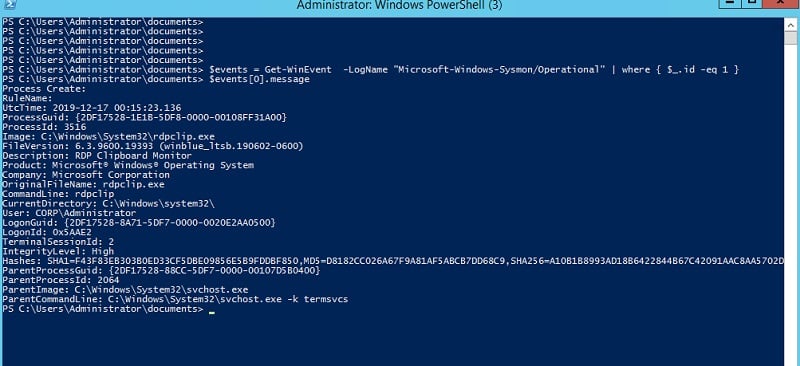
Are you thinking what I’m thinking? With a little more effort we can convert this into a JSON-formatted string and then load the string directly into a PS object using the powerful ConvertFrom-Json cmdlet.
I’ll show the actual PowerScript — it’s very simple — to do this in the next section. For now, let’s take a look at what my new cmdlet, called get-sysmonlogs and which I installed as a PS module, can accomplish.
Instead of having to dive into the Sysmon logs using the clunky Event Viewer interface, we can effortlessly search for incriminating activity from a PowerShell session, and use the PS where cmdlet (aliased by ?) to narrow down the results:
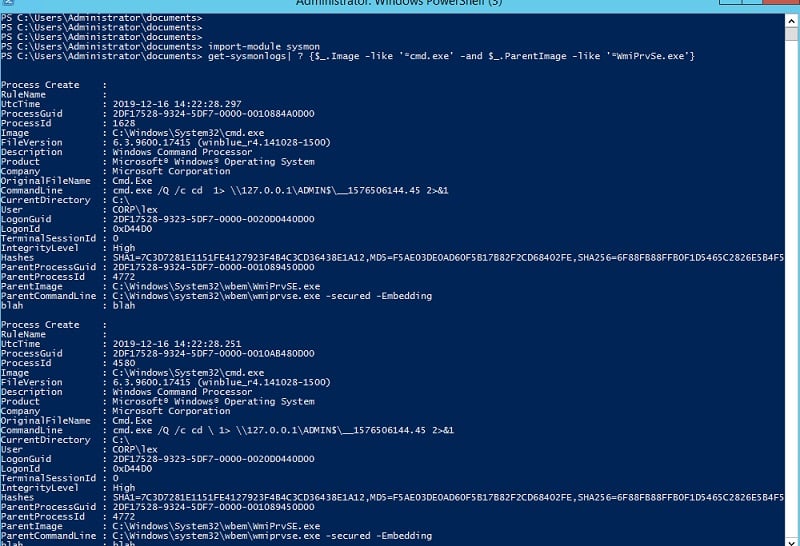
Amazing! I’ve created a tool that lets you query the Sysmon log as if it were a database. Those of you who recall my brief post on EQL know that this is exactly what this cool software does as well, though, more formally through a real SQL-like interface. Yeah, EQL is neat and we will explore it more later on.
Sysmon and Graph Analysis
Let’s sit back and appreciate what we’ve done. We now effectively have a database of Windows event information accessible through PowerShell. As I pointed out above, there are connections or links between those entries — through the ParentProcessId — so it would be possible to capture complete process hierarchies.
If you’ve followed our series on fileless malware, you know that hackers are fond of creating confusing multi-step attacks with each process performing one small part of the attack and then spawning the next step. This ain’t easy to detect looking at the raw logs.
But with my Get-Sysmonlogs cmdlet and an additional data structure which we’ll get into next time — a graph naturally — we have a practical way to detect threats. We just need to conduct the right searches among the nodes. Next time I’ll explain how to do this.
As always with our DIY blog projects, the far more important point is that by working out some of the details of threat analysis on a smaller scale, you begin to appreciate how complicated it is to do enterprise-level threat detection.
We’ll start getting a sense of the interesting complexities in Part II, when we begin to weave together Sysmon events into more complicated structures.
Part II: Using Sysmon Event Data for Threat Detection
In this section, we’ll get more into the weeds and start taking advantage of the detailed information found in Sysmon. Here are the three practical takeaways:
-
- Using PowerShell to directly access granular process information
- Building and visually displaying process hierarchies, which is an important first step in threat hunting.
- Leveraging Sysmon metadata for important metrics useful for advanced threat hunting — counting frequency at which particular processes are launched.
Leveraging Get-Sysmonlogs
Let’s now take a closer look at my amazing cmdlet that translates from Sysmon events into PowerShell objects. I’m somewhat proud of the fact I didn’t have to manually code a line for each of the fields. And here’s the great reveal:
$events = Get-WinEvent  -LogName "Microsoft-Windows-Sysmon/Operational" | where { $_.id -eq 1 }

foreach ($event in $events)  {
    $ev = $event.Message -split "`r`n"
    $jsons="{ "
    foreach ($line in $ev) {
        $line=$line -replace "\\","\\" `
               -replace "\{"," " `
               -replace "\}"," " `
               -replace '"','\"' `
               -replace "`n"," "
        $line=$line -replace '(\s*[\w\s]+):\s*(.*)', '"$1":"$2",'
        $jsons = $jsons + $line }

        $jsons =$jsons + '"blah" : "blah" }'
        ConvertFrom-Json -InputObject $jsons
    }
}
The whole shebang is now on Github, and you can download and import it as a sysmon module for your own project. The only wonkiness involves removing a few unpleasant characters — brackets, backslashes, line feeds, quotes — to make it more Json friendly.
Let’s do more with get-sysmonlogs. So … a classic signal of an intruder poking around the system is the use of the command “whoami”— often followed by “hostname”. A hacker (or perhaps insider) who’s obtained someone else’s credential wants to make sure their impersonation is working so they’ll type the aforementioned commands when they’ve landed on a victim’s server. For the rest of us, whoami and hostname are not words we’d enter into our shell sessions — if we ever even use a shell.
With my neat cmdlet giving access to all the Sysmon log entries, we can easily cook up a pipeline that filters on the process name (as we did in Part I). And we can get a little more granular with Sysmon, and look at the parent’s command line.
Usually, when hackers get in and have shell access, it’s often with the legacy cmd shell — which is what happens, by the way, when hacking with psexec or smbexec. With the output of get-symonlogs, we can hunt for whoami processes that have been spawned by these creaky shells — good evidence pointing to a threat.
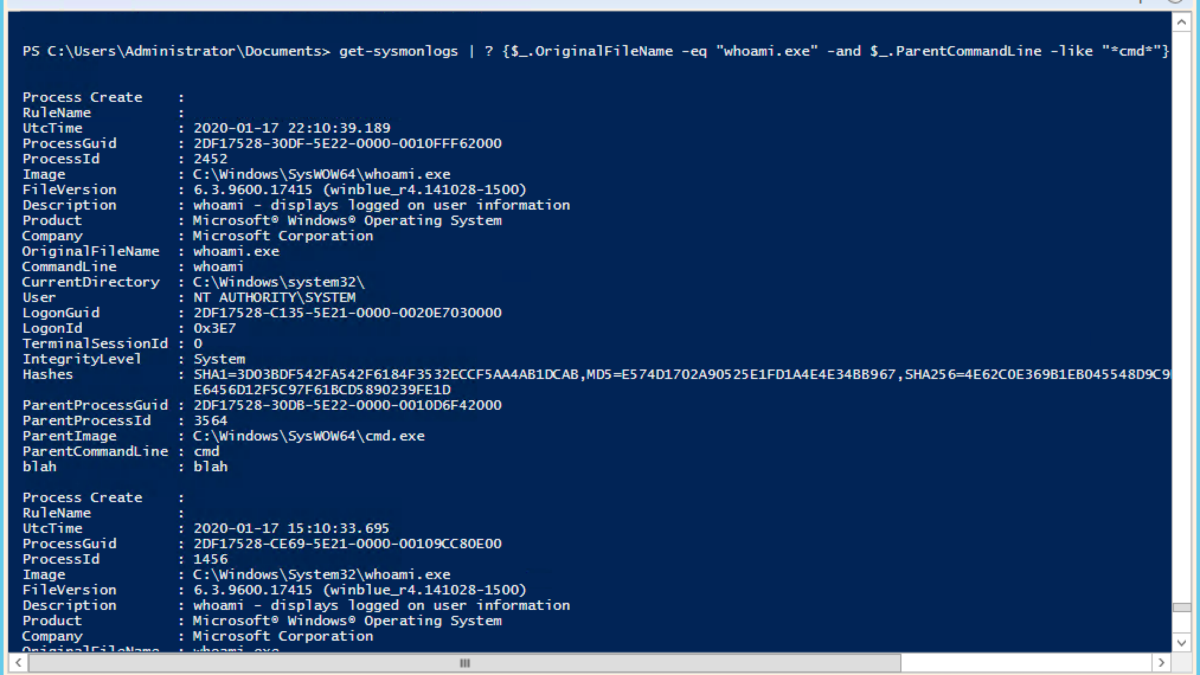
For practical purposes searching through the very raw Windows Event logs and connecting processes is not possible. As we just saw, Sysmon log entries can open up lots of threat analysis possibilities. Let’s continue our exploration by mapping the Sysmon information into more complicated structures.
Data Structures 101: Lists and Graphs
Not only do the Sysmon logs entries give us the parent command line, but also the parent’s process id!
You’re probably one step ahead, but let me spell it out: we can now connect together processes into hierarchies and, dare I say, networks. Tapping into basic Comp Sci 101 knowledge, there is some natural data structure we use to capture this information. Linked lists and graphs immediately come to mind.
At first, I thought I’d have to dust off my copy of “Data Structures for Poets and Sous Chefs” but the Intertoobz came to my rescue. I stumbled onto Doug Finke’s wondrous collection of core algorithms on Gihub, written in PowerShell. Thanks, Doug!
After getting past the minor learning curve, I was able to use his data structure algorithms to start organizing my Sysmon event data. I built list and graph data structures, and then using the APIs, wrote up a PowerShell function to search for a command and list out the process hierarchy. Cool.
I called it show-threat-path. It does a depth-first search on the process hierarchy and lists out the application names and the associated command lines for a root application given by a parameter. For my first test, I searched on “whoami.exe”. Like so …
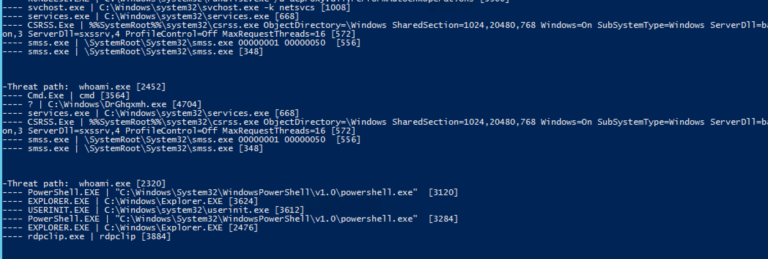
Extra points if you noticed in the output snippet above that the whoami associated with the process Id of 2542 was spawned by the legacy cmd shell, which in turn was run by a weirdly named executable in the Windows directory.
Hmmm. If you’re familiar with the mechanics of a remote psexec — covered here — then sirens should be going off. I’ll let you in on a secret: playing the part of the hacker, I previously launched this whoami from a remote Linux server using the Impacket python scripts.
So the point is that with the nutrient-rich Sysmon logs and some PowerShell, you can cook up practical threat hunting tools, like what I just did with show-threat-path.
Sysmon Threat Hunting With Directed Graphs
Now it’s time to get a little wonkier. With all this process trace information obtained from Sysmon, I can look at the connections in a more general way. I want to think of the applications that get launched — PowerShell.exe, Explorer.exe, etc — as nodes in a graph, and then make connections to whatever app had in turned launched it. In effect, I’m creating a roadmap that shows how all the apps communicate with each other (rather than creating separate nodes for each process instance.)
Technically, I’m talking about a directed graph where the road, so to speak, is one-way from the app to its parent.
At this point, it probably makes sense to gaze upon a graphic of what I’m talking about. Fortunately, there’s a wonderfully delicious PowerShell graph visualization tool known as GraphViz that has drop-dead easy wrappers available through PSQuickGraph. So with this little bit of code …
#Let's graph it!!!
$gv = New-Graph -Type BiDirectionalGraph # PSQuickGraph
foreach ($e in $g.getAllEdges() )  { $g from Doug Fink's functions
    $vs= $e.startvertex
   $ve= $e.endvertex
    PSQuickGraph\Add-Edge -From $vs.value.Key -To $ve.value.Key -Graph $gv |Out-Null
}
Show-GraphLayout -Graph $gv
… we can visualize the complicated relationships between applications through GraphViz’s interface:
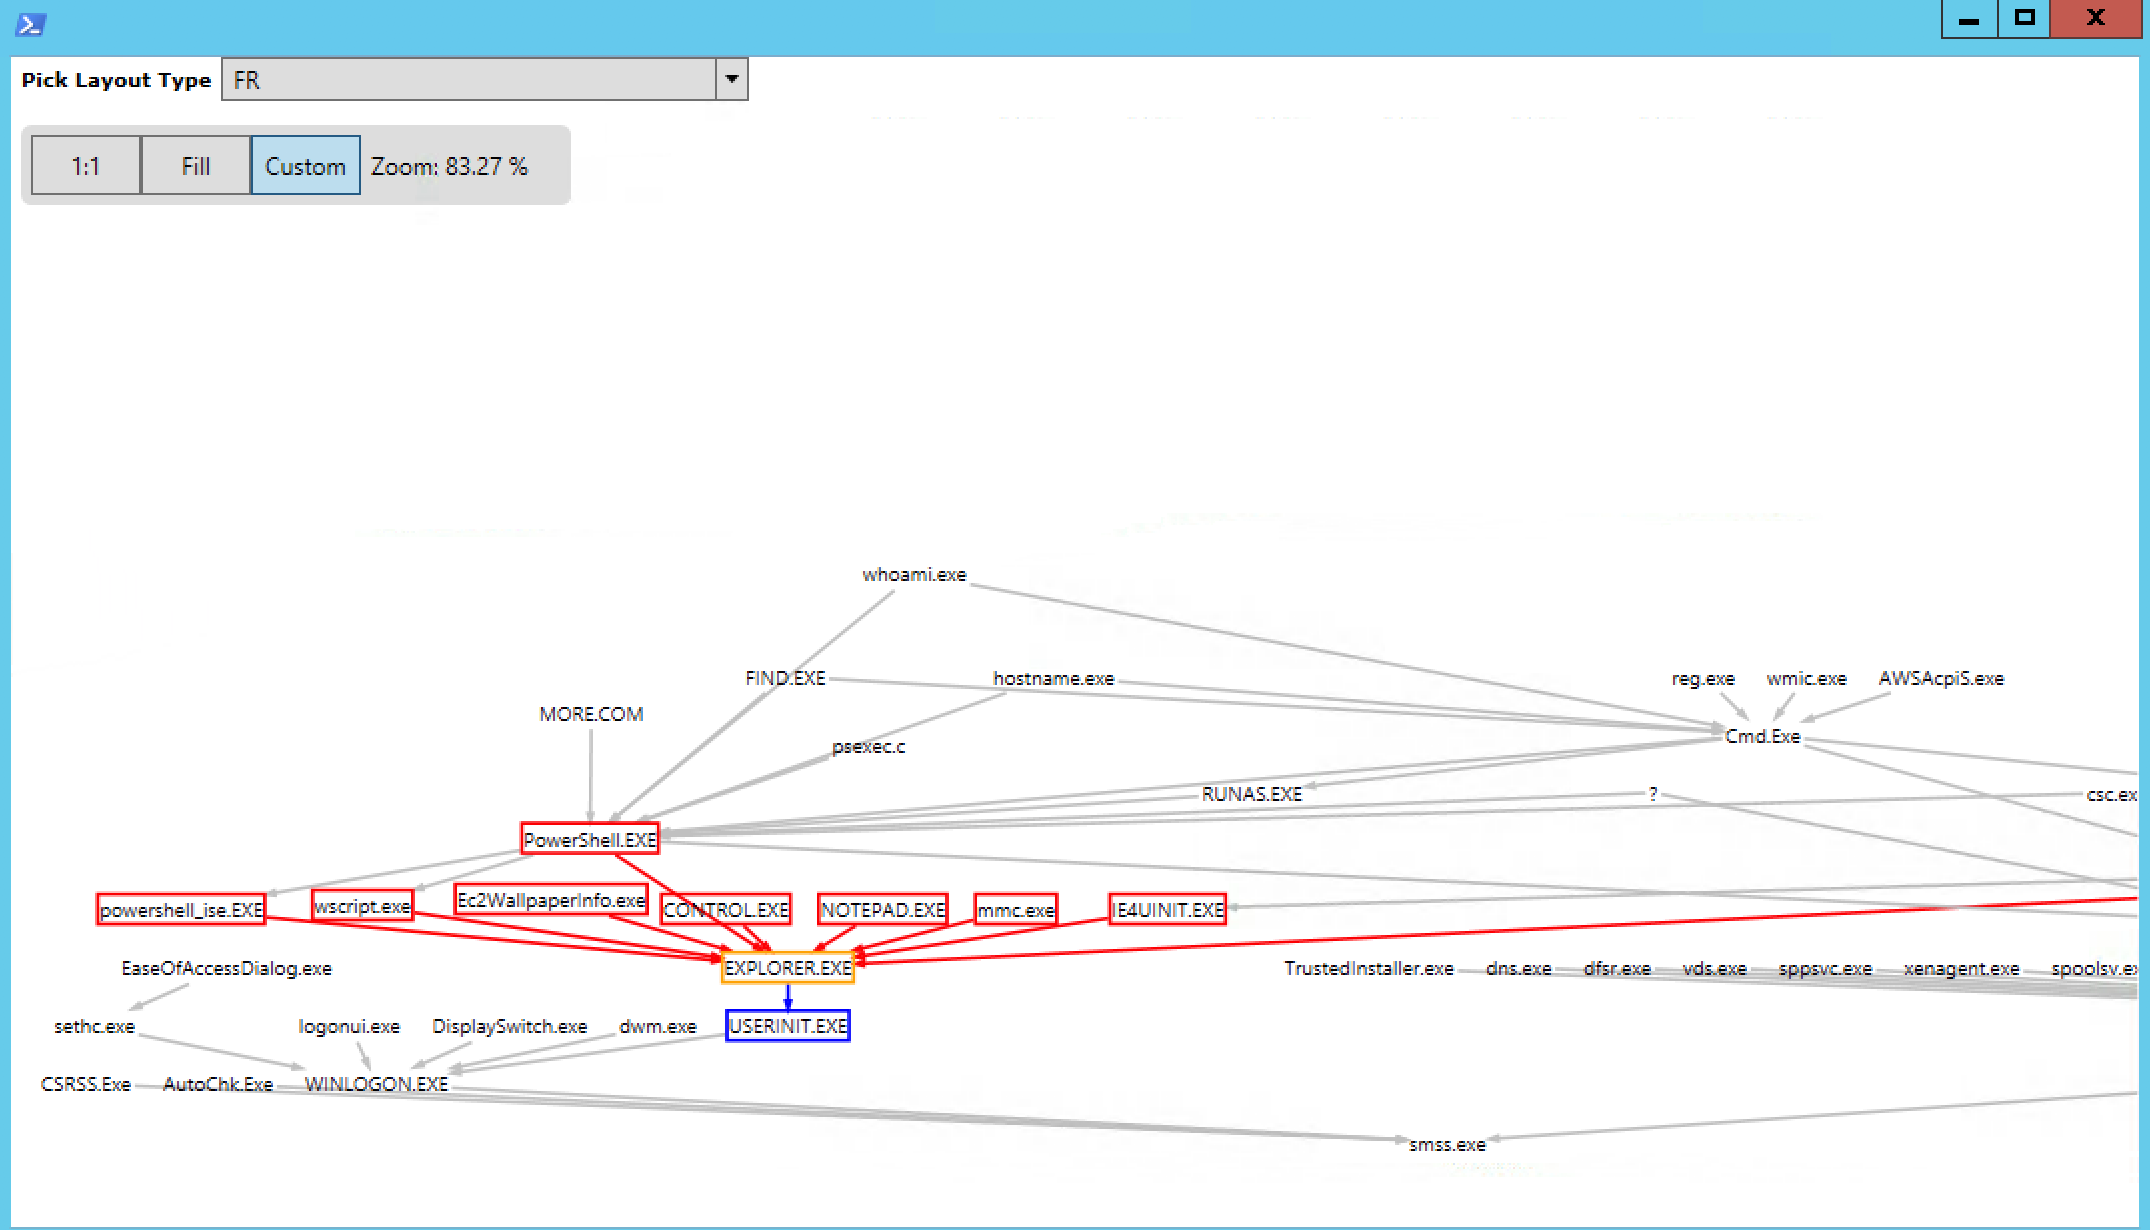
Where is this leading? There’s a graph-y way to spot threats! Instead of looking for specific text signatures as I did above with my show-threat-path cmdlet, we can try to find irregularities in a graph.
The idea is that you work out what are normal neighborhoods or sub-graphs — usually, they appear entangled in a visualization — and then try to spot what appears to be less connected nodes. In fact, your eyes are pretty good at doing this. Thankfully, there are also some simple algorithms that can discover neighborhoods and find intruders.
The advantage of threat hunters with this approach is that hackers can change their techniques and obfuscate their attacks, but they can’t easily hide their graph patterns.
Check this space next week for a continuation of this discussion. If you’re so motivated, you can do a search on graph anomalies cyber threats to get a sense of how researchers deal with this gnarly topic.
And once upon a time, yours truly wrote up a post about using one technique to work out neighborhoods in a social network associated with … a famous Revolutionary War hero.
Part III: Finding Unusual Sub-Graphs With Sysmon Event Data (Simple Example)
Before we look at an example of spotting abnormal sub-graphs indicating a possible threat — if that doesn’t bring out the nerd in you, nothing will! — let’s step back and take a breath.
Here’s the warning I’m required to say: this blog post along with the Github code can’t possibly replace a business-class solution. It can help you find threats in smaller situations, but my noble intention is to help IT security staff understand and appreciate real-world threat solutions. And the way to do it is by creating one on your own (with help from me).
Home-brewed experiments will help you understand that it’s hard to scale a DIY threat detection software. You’ll have to work with big data sets and all that it entails: cleaning it (which ain’t easy), processing it efficiently (find the right data structures, algorithms, etc.), and then produce results with low false-positive rates so you won’t have your co-worker coming at you with pitchforks.
With that in mind, you may want to consider our own threat detection solution … but after you finish reading the series and doing your own experiments.
Weighing the Graph
One simple way to build a threat detection solution that’s not completely dependent on malware signatures is to use the threat graph I introduced in the previous section.
It’s a graph connecting process nodes based on the Sysmon event log. Remember: I didn’t map each start process event (Sysmon event id 1) into a separate node. Instead, I created a more abstract graph showing that, say, the PowerShell node has a single connection to any app it has launched by any user— one for Excel, IE browser, etc.
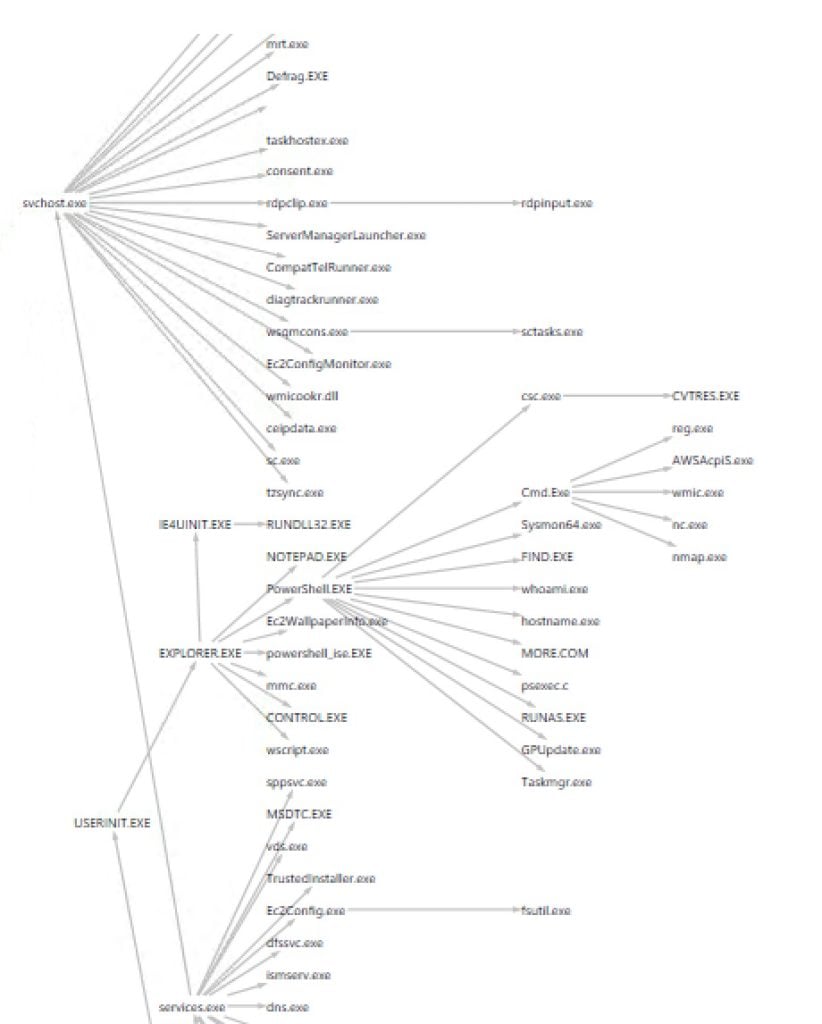
PSQuickGraph's tree view of my Sysmon threat graph. Warning, warning: the branch under cmd.exe is anomalous!
However, you do want to keep track of the frequency of these process events. So if PowerShell had launched “whoami.exe” only one time and the Windows legacy editor “notepad.exe” ten times, the edge in the graph from the PowerShell node to each of the aforementioned nodes would have been assigned a “weight” of one and ten. Got that?
In many simple graph anomaly detection algorithms, this weight becomes a metric used to compare regions of the threat graph. The key insight is that a sub-graph that has a lower average weight compared to the overall graph average is suspicious.
Right? Since it’s less well-traveled, it’s an unusual region. And then when examining for a possible threat, if user activity finds its way to a less frequented part of the sub-graph, it’s time to raise the alert level to yellow.
The approach I’m describing and the PowerShell scripts I’ll be introducing below are not meant to be a practical solution for a large system. But for a single server, it could be workable or, minimally, provide independent verification to whatever business-class tools you’re using.
Have I mentioned recently that Doug Finke’s data structure algorithms in PowerShell are powerful and delicious? I couldn’t have accomplished my graph anomaly project without his work. Thanks again, Doug.
With his PowerShell library of wonderful graph functions, I can easily take the weight of my Sysmon-based threat graph with just a few lines of PS code and also work out an average weight for a node for the entire graph. As the code traverses the graph, it assigns to each node the weight of all the edges coming from it, like so:
$AW=0 #average weight
$GW=0 #total weight

$mset = [System.Collections.ArrayList]@() #master set of subraphs
#calculate total weight by summing up the frequencies or weights of the edges
foreach ($e in $g.getAllEdges() ) {
    $GW = $GW + $e.weight
}
write-host "Weight of Graph: " $GW
$AW = $GW / $g.vertices.count
write-host "Average weight per vertex: " $AW

#assign weight of edges to vertice
for ($i=0; $i -lt $g.vertices.count; $i++) {
   $w=0
   $v=$g.vertices[$i]
   foreach($e in $v.getEdges()) {
      if($e -eq $null) {continue}
      $w=$w + $e.weight
   }
   $v.value.Weight = $w
}
The above code does the accounting we need. You can think of each node as having a frequency of visits based on the edges coming out of it.
The hardest part of my graph-anomaly PowerShell script — which I will post soon — is to find the regions of the graph that are less frequented and then find the largest sub-graph containing it. You may have to brush off your old computer science books to do this. But it’s not that difficult to code!
I used a classic breath-first-search of my graph, visiting every node, and then extending it with neighboring nodes until the sub-graph reaches a certain threshold based on the average weight of a node. Like so …
function extend-subgraph($v, $t) {
    $vertexQueue = New-Object Queue

    #initialize
    $vertexQueue.enqueue($v)
    $h=$v.value.Weight
    $s=@() #subgraph
    $s+=$v
    $extend=$false
    while (!$vertexQueue.isEmpty()) { #bfs
        $currentVertex = $vertexQueue.dequeue()
        $es= $currentVertex.getEdges()
        foreach($e in $es) {
            $ev= $e.endVertex
            if ((($h + $ev.value.Weight)/($s.count+1) -lt $th)  {
                #extend the sub-graph
                $s+=$ev
                $h =$h + $ev.value.weight
                #queue it up
                $vertexQueue.enqueue($ev)
            }
        }
   }
   if $s.count -ge 2) { $global:mset.Add($s)|Out-Null} #big enough to snag
}
A small note for DIYers: to create an array of arrays use the PS arraylist type, you’ll save yourself a lot of headbanging.
Threats and Light Weight Sub-Graphs
There are many graph anomaly algorithms in the wild. The one I used is based on something called graphBAD that I found on the Intertoobz — and I’ll provide a reference to it as soon as I find it again.
In general, a major problem with practical threat detection is finding a good baseline dataset. As a full-time blogger and part-time threat detector, I couldn’t create an interesting enough Sysmon log containing lots of apps. It was a little difficult to generate anomalous sub-graphs since I didn’t have a large enough spread in weights. Anyway, you’ll likely have a better dataset using a real-world server and not, as in my case, an occasionally used AWS Windows instance.
The graph-anomaly PS script I wrote spewed out possible anomalous sub-graphs with low average weights. And I did catch a few interesting neighborhoods (below).
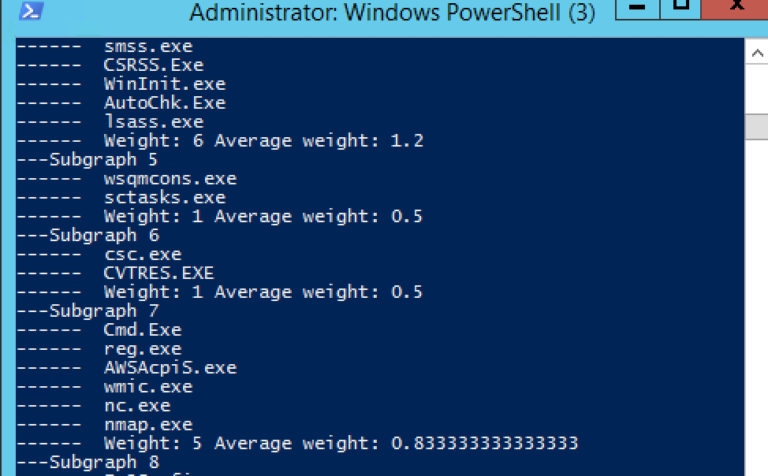
As I mentioned, there are other graph anomaly algorithms that use different metrics than a raw weight and are also worth exploring. One of them looks at clusters of “similar” nodes and spots connections or bridges between different neighborhoods. An anomaly is then the users or processes that link the neighborhoods with different characteristics. Makes sense, right?
If the nerd is strong in you, check out SCAN (Structural Clustering Algorithm for Networks) which does what I describe above. With Doug Finke’s PowerShell algorithms, you can even implement it. And I’ll assign myself that project and post on my Github repository soon.
Finding Anomalies With Random Walks
Let’s end this section with one more way to find anomalies in the threat graph. I referenced this concept at the end of the last section. For me, it’s more intuitive and has a firmer math-y footing. And fans of the old TV show numb3rs will immediately recognize the concept of [clearing throat] Markov chains.
For the rest of us, we can think of this as a “random walk” through the graph. At each node, we throw the dice and pick an edge based on its weight: the higher weighted edges have a higher chance of being traversed. You need to break the graph into two-parts — called bipartite among graphologists — with users in one section and applications in the second.
You end up ranking all the application nodes that can be reached from a user by how probable it is to get to a particular node. In analyzing a threat, you then look at the applications launched and if some have a very low probability of being reached according to the analysis, then you may have discovered a real threat!
Extra points if you made the connection between what I just described and Google’s PageRank algorithm. I’ll describe this in more detail in the next section, but if you’re curious you can search for random walk with restart.
Part IV: Random Walk Theory and Practical EQL
Let’s step back and review what we’re trying to accomplish with the Sysmon log, which is an incredible resource for detecting threats and doing post-incident forensic analysis.
-
-
- In Parts I and II above, I showed how to parse and pull out basic process information from Sysmon data. But there’s more information buried in the Sysmon log if we think of the parent process and child process relationship as a link in a graph.
- In Part II , we organized the Sysmon log data as a graph, which bring in a lot more context, and that allows us to move beyond looking for specific malware signatures.
- In Part III, we dove into one simple algorithm that looks at edge connections as a kind of weight. Sections of the graph that are less “weighty” (in terms of edges) than the overall graph average may point to possible threats. I’ll be posting the PowerShell for the algorithms in this section on my Github account (after I finish polishing them up).
-
The advantage of these methods is that they avoid dependency on specific command lines or process names, which the attackers are always changing or obfuscating.
Finally, there is another method that I mentioned at the end of the last section that relies on randomness to find threats! Let’s dive deeper into that.
Random Walking Through the Threat Graph of Sysmon Event Data
Instead of analyzing the graph structure, we can instead view the connections as a kind of path or road map with each application node as a stop along the way. We can derive from the Sysmon log the frequency with which each application is launched from its parent.
If you check out my threat-graph script in Github you’ll see that this frequency is saved in each edge object, using Doug Finke’s wondrous PowerShell graph algorithms.
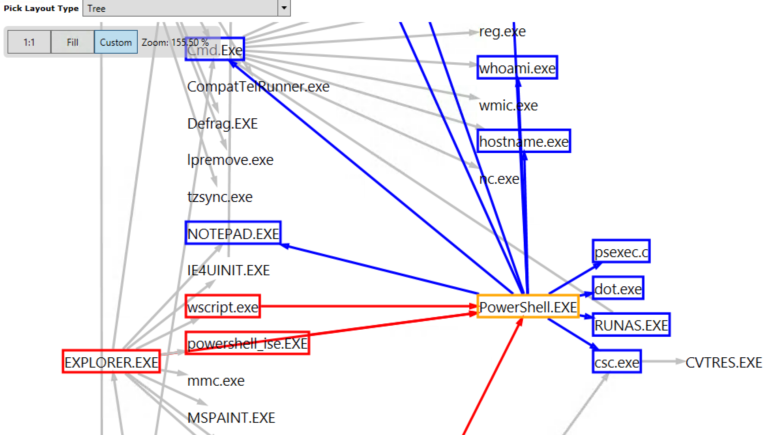
You can think of the frequency with which each of these edges are crossed in the threat graph as a probability!
It’s a short step then to leverage information to work out the probability of, say, PowerShell, launching taskmgr.exe, the Windows process analyzer, or nodepad.exe, or hostname.exe.
Where am I going with this?
In short: I can create an, ahem, probability transition matrix beloved by followers of Mr. Markov and used heavily in the modeling of systems. In effect, rolling the dice, jumping to the next application node in the graph, and repeating — a random walk through the graph. Ultimately, this math-y method ranks each node in the graph based on the likelihood of getting there from a starting point. You’ll be able to learn that, for example, launching a spreadsheet from the Windows File Explorer is very common, but a Windows Script Host Engine might be theoretically very unusual and therefore possibly an indication of a threat.
This method is known as Random Walk With Restart (RWWR) and is a variation on the now legendary Google PageRank algorithm.
Let’s take a peek at part of the script I wrote for calculating these rankings:
#lets build a row
$row= @(0)*$g.vertices.count
$w=0

foreach($e in $start.getEdges()) {    #calculate total frequency
    $w+=$e.weight
}
if ($w -eq 0)  {   #make it connected
$row[$ix] =1
}
else {  #we assign probabilitys
    #now create transition probability
    foreach($e in $start.getEdges()) {
        $ev = $e.endVertex
        $p = $e.weight
        $jx = v-index $ev.value.Key
        $row[$jx]= $p/$w #normalize by dividing by total
    }
}
$P[$ix] = $row  #yay! One row added to transition matrix
For each node, I work out the total frequency count for all of the neighbors and then assign the probability for each transition by using the total as a normalizer. So if PowerShell.exe has 20 visits to all its neighbors, but nc.exe has only been visited one time from the PowerShell node, then the transition probability is 1/20 or .05. Makes sense, right?
The tricky part is doing the matrix calculation that implements RWWR but it’s pretty standard if you’ve taken a probability modeling class. There’s a nice overview of what I’m doing in this enlightening post on Medium.
My script, which I call random-rater, ranks and then prints out the lowest 10 in the list. It’s a way to highlight the most unlikely apps to be launched when starting from a specific node in the threat graph. I used PowerShell as my point of origin, and you can see the results below:

Random Walk With Restart can give you a Google ranking for threats. Hmmm, whoami is the lest likely app to be launched.
As a practical matter and a warning, RWWR would be a big data problem on a real-world system. And even with my teeny Sysmon log, there was a noticeable lag in doing the calculations — lots of floating-point multiplications!
Event Query Language (EQL) for Threat Analysis
And this a good point to say that a vendor solution that productizes more advanced approaches for detecting threats, like what I’ve been suggesting above, are beyond what you or I could do on our own. And certainly far more accurate!
For those who want to dip their toes in the threat detection waters but don’t want to work with my scripts — I understand! — there is Event Query Language or EQL. It’s an open-source project that lets you apply a query language to the Sysmon log, which you can learn more about in this stunningly comprehensive post.
EQL is great for forensic work, but it can be be used as a threat detection tool as well — assuming you have a somewhat recent copy of the Sysmon log.
The EQL gang provides an event scraper that converts the log into JSON so it’s digestible. You can look at the copy I forked off in my Github account. Unlike my static show-threat-path PS script, EQL let’s you try on-the-fly searches.
Let’s say I was interested in all cmd.exe shells that were launched from svchhost.exe, which can be a sign of an attacker using psexec.exe or smb.exe. It would look like this:
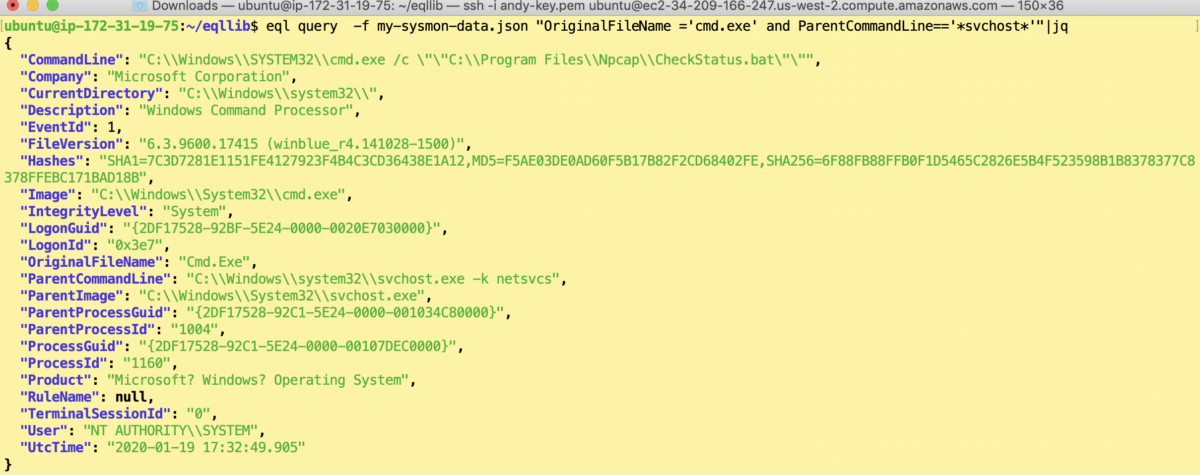
There’s a cooler and more powerful way to accomplish the above that uses the “descendant of” qualifier. This EQL statement allows you to search for all processes that have a specific ancestor anywhere in the hierarchy. For example, you might be interested in apps that have, say, regsvr32.exe as an ancestor and could have exploited a well-known vulnerability that I covered here.
There’s way too much to cover with EQL in this already long post, so I will publish more details on EQL threat hunting prowess in another post.
Closing Thoughts on DIY Threat Solutions
I promise to load the Sysmon repository with all the threat detection scripts I mentioned in this post. Periodically check back at my Github repository because I’ll be also be adding more PS graph-based threat detection utilities and some additional documents — too much to cover in this post.
If you’ve gotten this far, congratulations!
Try my scripts, or use them as a basis for developing your own threat ideas. PowerShell is up to the task of implementing sophisticated algorithms! As someone who grew up on Linux shell languages, it’s been a surprise, in a good way to work with this grown-up scripting language. And get to know the PowerShell Gallery, another great resource for battle-ready scripts: you don’t have to re-invent code in the PowerShell world.
The more important takeaway from all this is that enterprise-level vendor solutions not only have implemented more advanced threat ideas than an IT developer could ever build in his spare time, but they’re designed to handle enterprise-level traffic. Sure, using DIY solutions for analyzing underutilized servers or as additional validation for vendors’ software is a fine idea. But threat analysis and detection is indeed a big data problem, and obviously not a task that PowerShell was meant to handle.
If you’re interested in learning more about how Varonis does threat analysis and detection, ask for a demo today!
What should I do now?
Below are three ways you can continue your journey to reduce data risk at your company:
Schedule a demo with us to see Varonis in action. We'll personalize the session to your org's data security needs and answer any questions.
See a sample of our Data Risk Assessment and learn the risks that could be lingering in your environment. Varonis' DRA is completely free and offers a clear path to automated remediation.
Follow us on LinkedIn, YouTube, and X (Twitter) for bite-sized insights on all things data security, including DSPM, threat detection, AI security, and more.


-1.png)


